Bonus

To determine the crossing number of a K(9,9) I coded it on mathematica to get a visual of what I was dealing with and I noticed it was nearly impossible to figure out how many edge crossings were happening so I used

Using Zarankiewicz’ Conjecture crossing number theorem in order to figure out the crossing number mathematically. This was the only way I found to summarize the question at hand in a reasonable manner. Everything illustrated below.

Image

As you can see it is very difficult to determine the crossing edges.


Image


K(9,9)= [9/2][9-1/2][9/2][9-1/2]= 324

All though it has been conjectured to be 256.

Problem 4.)

The reverse of a relation R on a set A is the relation denoted by \overleftarrow{R}and defined by:

\overleftarrow{R} :=\{(a_i, a_j)\in A\times A: (a_j, a_i) \in R)\}

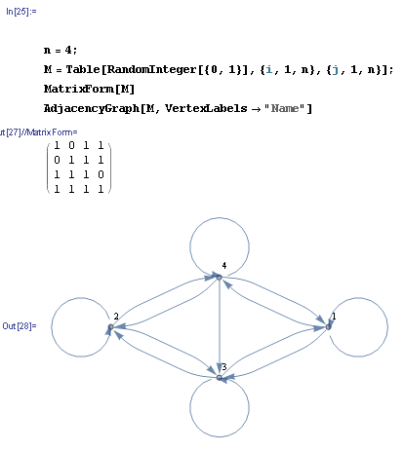
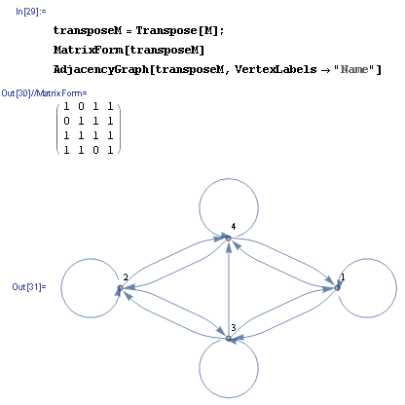
    • Argue that the matrix for the reverse relation R is the transpose of the matrix for R and use this, together with the Mathematica function Transpose, to draw the graphs of the reverse of several random relations on a small size set A.


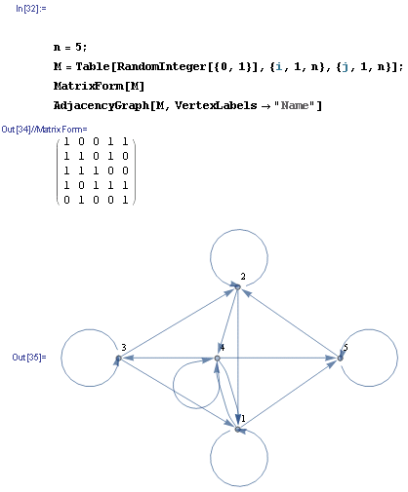
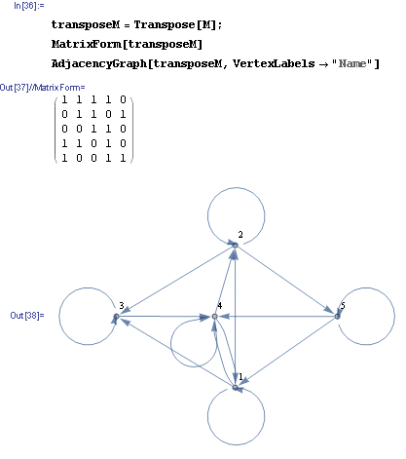
What I did was graph the orginal matrix of a function and then graph the transpose of it to show what changed during the transposition. This is illustrated below with two different examples.

ImageImage

Example 2

Image

Image

The transpose function in mathematica altered the graphs just a little in both cases but just enough to make a difference.


Problem 2.) Generate random relations on finite sets

  1.  If (a_i, a_j) \in R \textrm{ and } (a_i, a_k) \in R \textrm{ then } a_j=a_k
  2. For each i \textrm{ there is a } j \textrm{ such that } (a_i, a_j)\in R               

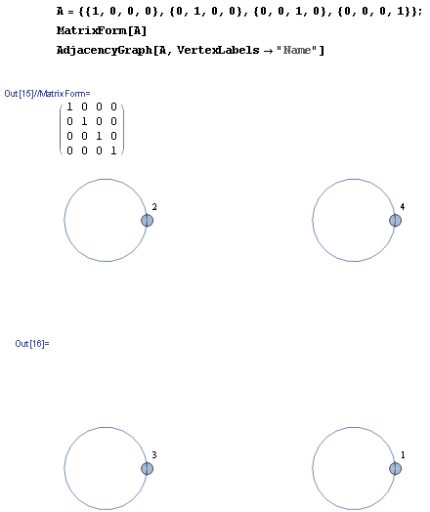
For this problem we just had to simply make a AxA matrix that will show only 1 entry in each matrix. Therefor making it so there is only 1 arrow emanating from the matrix. This is shown in the illustration below where I plotted 4 different functions each showing its one arrow returning to itself. 


Image

This just goes to show that for the matrix AxA the number of relations on a set of size n equals n=2(n*n).


Problem 1.) Relations on Finite Sets

Both the matrix and the directed graph can be used to represent a relation on a set. If an element in R, say R_i,_j, is 1, then in the directed graph, node a_i points to node a_j. So the directed graph allows us to “see” the relation in a much more visual way. (Originated by Lei Zhang)

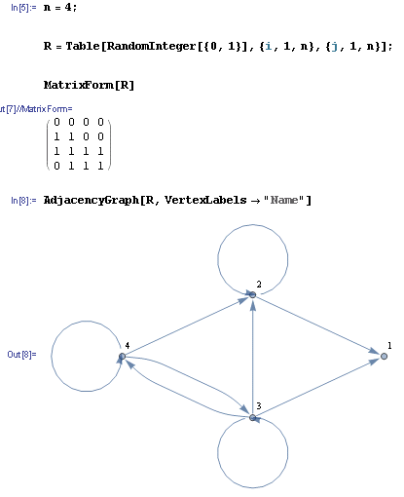
All though the directed graph allows us to put a visual to the formula we have as n increases to infinity it will get tougher and tougher to put together which relations are actually being combined in the graph. Below I have illustrated by using mathematica to compare to different direct graphs. One with a simple matrix formula and one with much more information on it to show how difficult things actually can get to visualize.

Image


Problem 5.) Growth Rate

5.) Plot the upper bound Z(n,n)=\lfloor \frac{n}{2}\rfloor^2\lfloor \frac{n-1}{2} \rfloor^2 for the crossing number of Z(n,n) as a function of n and discuss its growth rate.

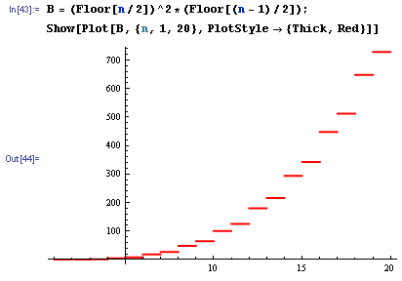
The graph below illustrates the function Z[n,n] and it is very clear to see that the function is exponential. This gave me the clear evidence that as I increased n to whichever amount the graph would increase much more rapidly.

Image

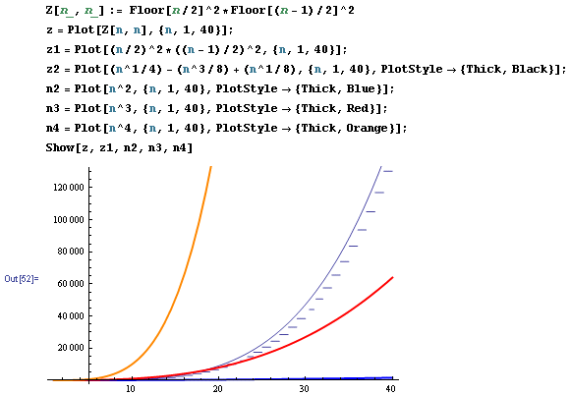
To demonstrate the different growth rates I compared multiple exponential lines in order to find which is closest to our designated line and which is the farthest. The graph is illustrated below .

Z[n,n]-dashed line

Z[n,n]- not floored is the light blue line

On2- Dark Blue line

On3- Dark Red

On4- Orange

Image

As we can tell by the graph none are really increasing at the rate of our original function but if we were to apply some type of constant to one of the above functions we could easily get different results that would allow us to come closer to an even growth rate.From the graph we can see that  O(n^2) and O(n^3) do not increase as fast as Z(n,n). The closest O(n) is O(n^4) which is the orange graph. if O(n^4) is multiplied by some constant, we can get closer to Z(n,n) .

Problem 4.) 3d Plot

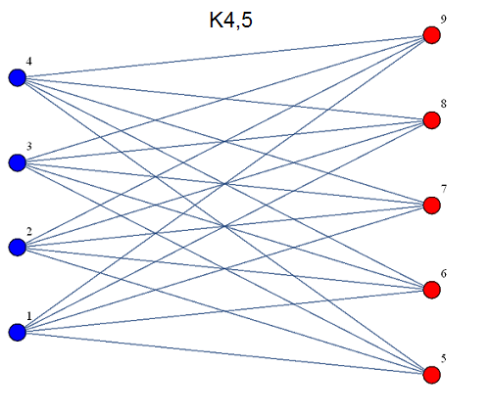
4.) The drawing of the first graph K(4,5) on this page generalizes to K(m,n) to show that the crossing number of K(m,n) is leq lfloor frac{m-1}{2}rfloorlfloor frac{m}{2}rfloorlfloor frac{n-1}{2}rfloorlfloor frac{n}{2}rfloor

In Mathematica, define the function

Z[m_,n_]:=Floor[(m-1)/2]Floor[m/2]Floor[(n-1)/2]Floor[n/2]

and create a 3D list plot of Z[m,n] for 1leq m, n leq 20

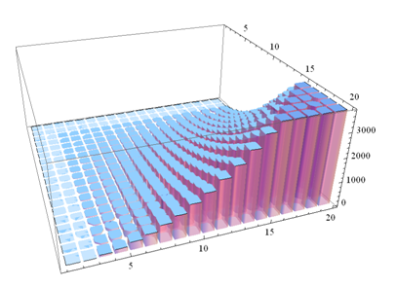
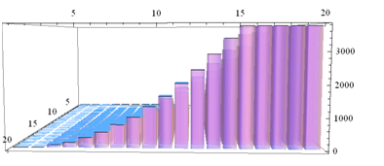
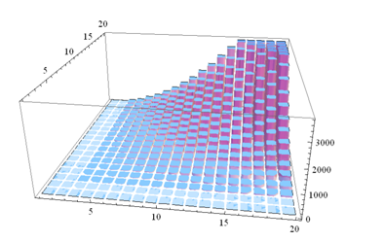
The following code allowed me to plot the graph in 3D the graph is illustrated below.

Plot3D[(Floor[(m – 1)/2])*(Floor[m/2]*Floor[(n – 1)/2])*(Floor[n/2]), {m, 1, 20}, {n, 1, 20}, Filling -> Axis, Mesh -> None]

ImageImageImage

Problem 3.) The Floor Function

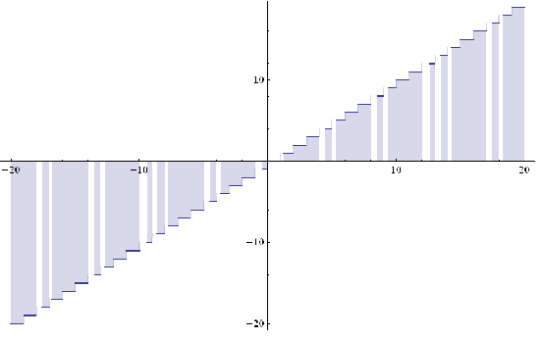
The floor of a real number x is the greatest integer \leq x. The floor of x is commonly denoted by \lfloor x\rfloor. In Mathematica the floor of x is denoted Floor[x]. Plot Floor[x] for -20 \leq x \leq 20.

For problem 3 I plotted the floor function on mathematica using the following strip of code and the resulting image is below.

Plot[Floor[x],{x,-20,20},Filling –>Axis]

 Image

Problem 2.) Complete Bipartite

(2) The complete bipartite graph K(m,n) has a set of m red vertices and a set of n blue vertices, such that every red vertex is joined to every blue vertex, and vice versa (note: colors are irrelevant – for convenience, only). The first graph on this page is the complete bipartite graph K(4,5). The Mathematica commands:

G= CompleteGraph[m, n]

GraphPlot[G]

return a planar drawing of the complete bipartite graph K(m,n)


For this problem I simply plugged in the following code in order to receive the complete bipartite graph of the K(4,5).

CompleteGraph[{4, 5}, PlotLabel -> {K4, 5},
VertexStyle -> {1 -> Blue, 2 -> Blue, 3 -> Blue, 4 -> Blue, 5 -> Red,
6 -> Red, 7 -> Red, 8 -> Red, 9 -> Red},
VertexSize -> Medium, VertexLabels -> “Name”]

Image